
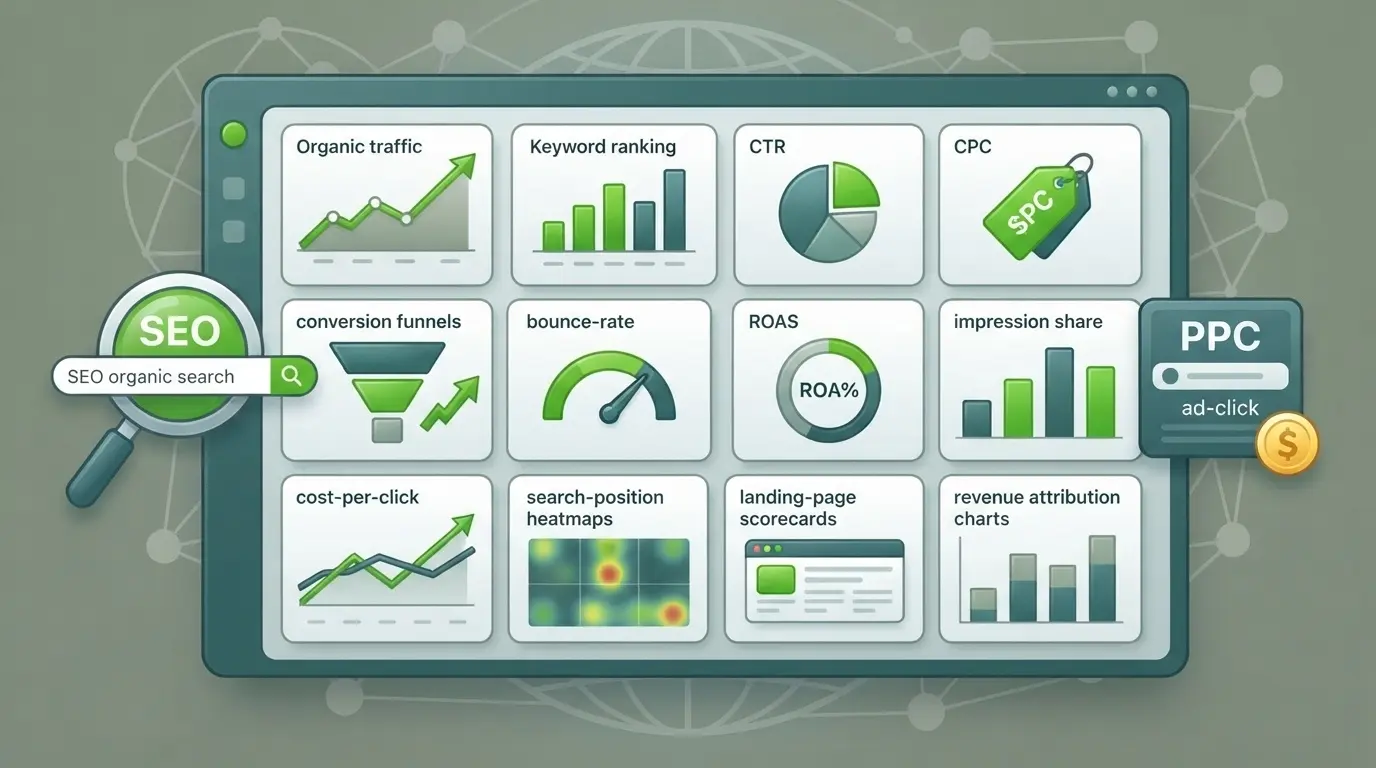
SEO and PPC analytics work best when they share one view of demand, cost, and revenue. A single dashboard built around a small set of numbers reduces reporting noise and speeds up decisions across content, bidding, and landing pages. This guide outlines the 12 numbers that belong in one dashboard and how to use them without overcomplicating your stack.
Why One Dashboard Matters?
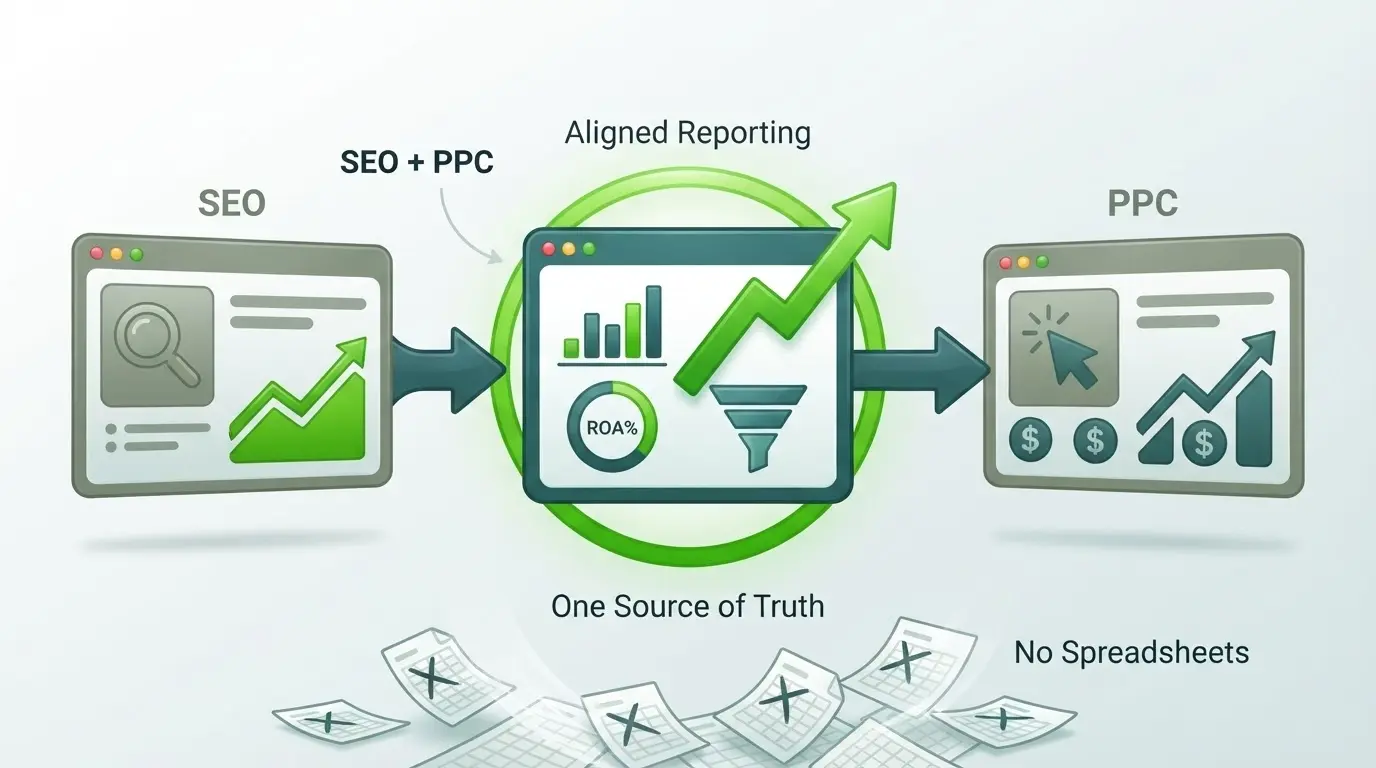 Search teams often track SEO and paid search in separate tools, then reconcile results in spreadsheets. That split creates delays, duplicated work, and debates about which channel deserves credit.
A unified dashboard improves alignment. It lets you see what searchers want, what you pay to capture demand, and what you earn back, all in one consistent reporting frame.
What A Shared Measurement Foundation Looks Like?
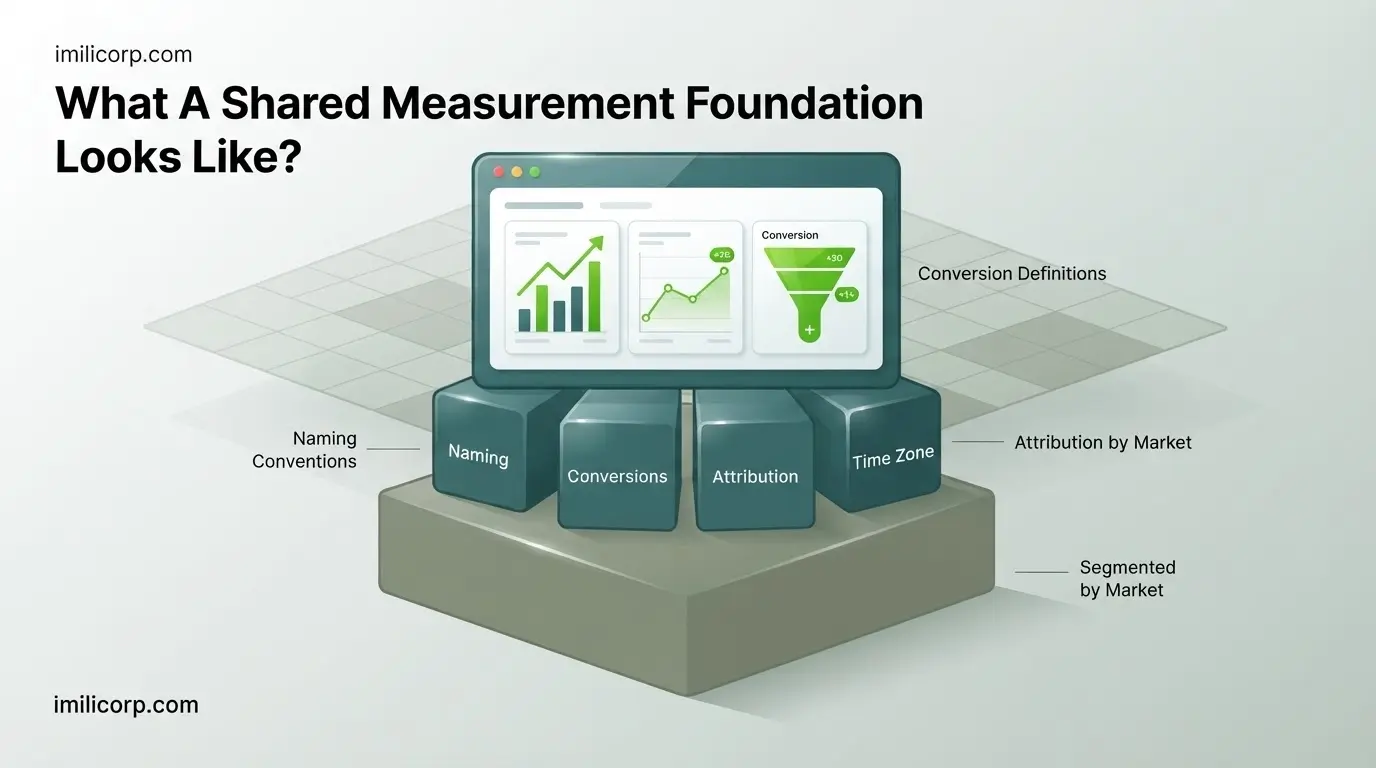 Before the numbers, the foundation must be consistent across channels. If naming conventions, conversion definitions, or attribution rules vary, the dashboard becomes a polished argument rather than a source of truth.
Keep one set of conversion actions, one currency, one time zone, and a clear rule for what counts as a lead or sale. If your organization uses multiple sites or regions, segment the dashboard by market to avoid blended signals.
The 12 Numbers That Belong In One Dashboard
These metrics cover demand, visibility, efficiency, and business outcomes. They are deliberately limited so the dashboard stays actionable and comparable across SEO and PPC analytics.
Total Search Demand
Track total impressions across paid and organic as your best proxy for search demand at the query and theme level. This number explains whether performance changes are driven by market shifts or by your own execution.
When demand rises, both channels can grow without dramatic efficiency gains. When it falls, the dashboard helps prevent overreacting with budget cuts or content churn.
Organic Clicks
Organic clicks measure how well your pages earn traffic without media spend. This number should be segmented by branded and non-branded intent to avoid false comfort from brand-driven spikes.
If organic clicks decline while demand stays flat, prioritize technical fixes, content updates, and SERP feature coverage.
Paid Clicks
Paid clicks show how much demand you are purchasing and how reliably you can scale coverage. It is also a signal for landing page fit, since irrelevant ads tend to reduce click volume through weaker auction performance.
Watch paid clicks alongside cost and conversion rates, not in isolation, so growth does not hide declining efficiency.
Organic Share Of Clicks
Organic share of clicks compares organic clicks to total clicks from both channels. It indicates how well SEO is carrying the load when budgets tighten or auctions become more expensive.
A healthy share depends on your category and SERP layout. The goal is not perfection, but a stable baseline that supports planning and forecasting.
Paid Impression Share
Paid impression share reflects how often your ads appear when they are eligible. This number is essential for diagnosing whether performance is constrained by budget, rank, or eligibility issues.
Keep it close to your strategic intent. High impression share matters most on high-margin themes and on queries where organic visibility is limited.
Average Organic Position For Priority Themes
Average position is noisy at the keyword level, so use it for grouped themes that map to your most valuable journeys. Pair it with clicks, not just rank, because SERP features can change outcomes without large rank shifts.
When position improves but clicks do not, inspect titles, snippets, and SERP intent alignment.
Quality Score Proxy
Quality Score is a directional indicator for paid search relevance and landing page experience. If your reporting environment cannot pull the native score reliably, track a proxy based on expected CTR, ad relevance, and landing page engagement signals.
Improving this number reduces wasted spend and often lifts conversion rate without changing bids.
Cost Per Click
Cost per click is the clearest view of auction pressure and bidding efficiency. It should be segmented by match type and by query themes, since blended CPC can hide expensive segments.
When CPC increases, evaluate whether the rise is driven by competition, broader targeting, or lower relevance scores.
Conversion Rate
Conversion rate should be consistent across SEO and PPC analytics by using the same conversion definitions and counting rules. Track it by landing page template, device category, and intent group.
If conversion rate drops in both channels, investigate site speed, form friction, offer clarity, and tracking health before changing bids or content strategy.
Cost Per Acquisition
Cost per acquisition is the paid channel control lever for profitability. It should be paired with lead quality signals if your business has long sales cycles.
CPA trends help you decide whether to reallocate budget, tighten targeting, or invest in landing page improvements.
Revenue Per Visit Or Lead Value
If you have ecommerce, track revenue per visit across both channels. If you generate leads, track a lead value metric that reflects pipeline value or expected revenue, not just form fills.
This number is where SEO and PPC analytics connect to business outcomes. It prevents the dashboard from becoming a traffic-only scoreboard.
Blended Return On Ad Spend Or Marketing Efficiency Ratio
A final blended efficiency metric ties the dashboard together. For ecommerce, blended ROAS can include paid spend and organic revenue influence in a unified view. For lead generation, a marketing efficiency ratio can compare total search-driven revenue to paid media cost.
This helps leadership understand whether search as a whole is improving, even when the mix between channels shifts.
A Simple Dashboard Layout That Stays Actionable
Once the 12 numbers are defined, place them in a structure that mirrors how decisions are made. A good layout separates market demand from channel execution and from business outcomes.
Use a top row for outcomes, a middle row for efficiency, and a bottom row for visibility and demand. Keep filters minimal, such as date range, market, brand vs non-brand, and device.
| Dashboard Section | Primary Numbers | Decision Supported |
|---|---|---|
| Outcomes | Revenue Per Visit Or Lead Value, Blended Efficiency Metric | Budget Allocation And Forecast Confidence |
| Efficiency | Conversion Rate, Cost Per Acquisition, Cost Per Click | Bidding, Landing Page, And Offer Optimization |
| Visibility | Organic Share Of Clicks, Paid Impression Share, Average Organic Position | Coverage Gaps And Priority Theme Focus |
| Demand | Total Search Demand, Organic Clicks, Paid Clicks | Seasonality, Trend Shifts, And Growth Planning |
This structure keeps conversations focused. It also makes it easier to isolate whether a problem is demand-related, efficiency-related, or a tracking issue.
How To Operationalize Reporting Without Extra Complexity?
The best dashboard is the one your team uses weekly. Operationalizing SEO and PPC analytics means standardizing the cadence, alerts, and ownership, not adding more charts.
- Define one conversion rule: Align what counts as a conversion, how duplicates are handled, and how offline outcomes are imported.
- Segment by intent: Separate branded, non-branded, and high-intent themes so trends do not cancel each other out.
- Set thresholds for investigation: Agree on what change in CPC, conversion rate, or impression share triggers a review.
- Assign owners per metric group: Give one owner visibility metrics, one owner efficiency metrics, and one owner outcome metrics.
- Review on a fixed schedule: Use a weekly check for performance and a monthly review for structural decisions like taxonomy, content clusters, and budget shifts.
With these habits in place, the numbers become a management system rather than a reporting artifact.
Common Pitfalls That Break Trust In Search Reporting
Dashboards fail when stakeholders stop trusting the inputs. These are the most frequent issues that undermine SEO and PPC analytics in one view.
- Mismatched attribution rules: Different lookback windows and models create conflicting conclusions across channels.
- Blended brand and non-brand: Brand demand can mask declines in discovery traffic and inflate perceived efficiency.
- Inconsistent landing page grouping: Changing URL structures without mapping redirects breaks trend lines.
- Unmonitored tracking changes: Tag updates and consent settings can create sudden shifts that look like performance changes.
- Too many vanity metrics: Adding metrics that do not lead to a decision slows down action and increases debate.
Fixing these issues early protects credibility. It also makes optimization conversations faster and less political.
Where A Partner Can Help Without Turning It Into An Ad?
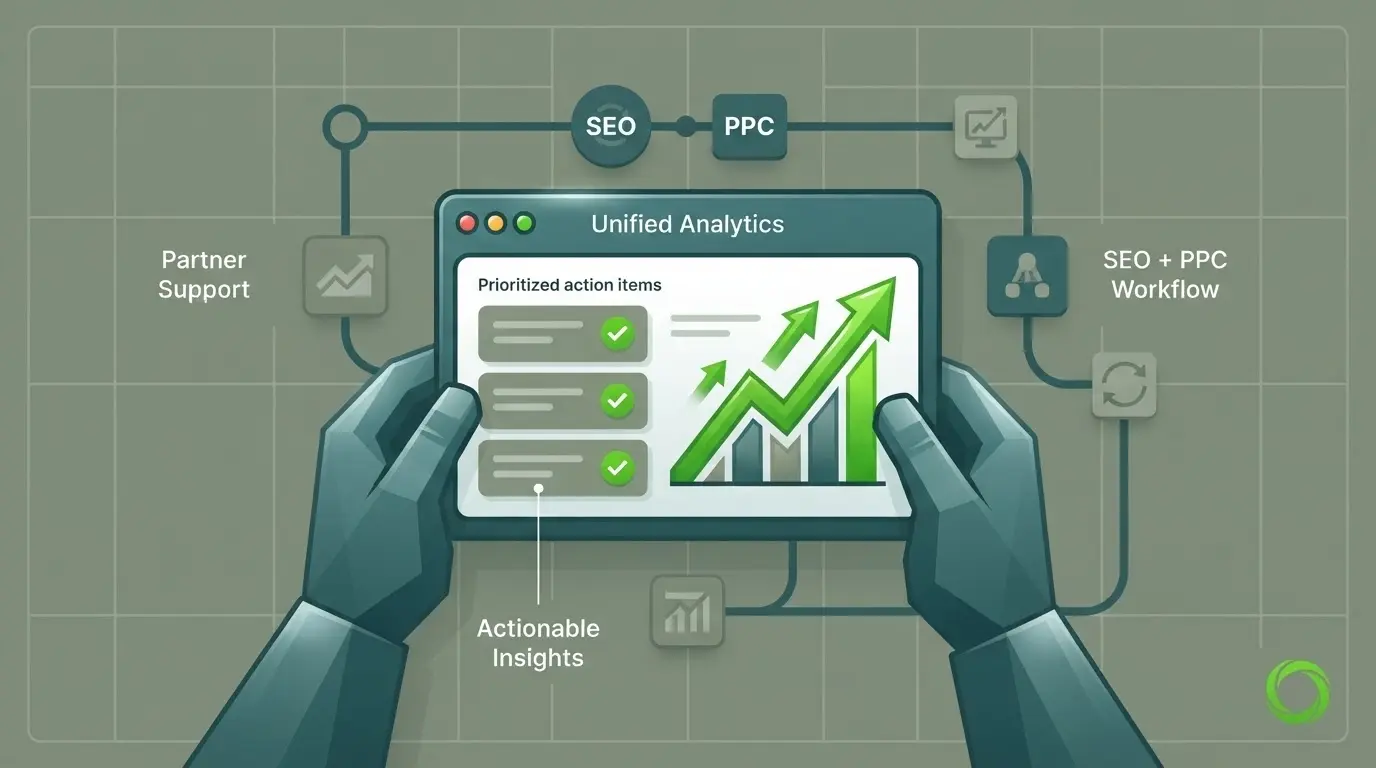 When search programs scale, the friction is usually in measurement, taxonomy, and governance rather than tactics. Teams often need help unifying tracking, building consistent reporting logic, and turning insights into prioritized actions across SEO and paid search.
If you want the dashboard to drive outcomes, a performance partner that supports both organic and paid search can help consolidate analytics, streamline reporting, and build a repeatable optimization workflow. Imili Corp’s focus on measurable growth and integrated digital execution makes it a practical fit when you need SEO and PPC analytics to operate as one system.
Conclusion
A single dashboard for SEO and PPC analytics should answer a few questions clearly. Is demand rising or falling, are you visible where it matters, are you paying efficiently for incremental growth, and are you producing revenue impact.
By focusing on these 12 numbers, you reduce noise, improve cross-channel decisions, and build trust in reporting. Keep the dashboard stable, review it consistently, and let deeper analysis live outside the main view when investigation is required.
Frequently Asked Questions
How Do I Choose Between Blended ROAS And CPA For One Dashboard?
Use blended ROAS when revenue tracking is reliable and transactions close quickly. Use CPA when the primary outcome is a qualified lead and revenue is delayed or difficult to attribute. If your business has both, keep one primary metric and one secondary metric to avoid conflicting optimization signals.
Should SEO And PPC Share The Same Conversion Actions?
They should share the same definitions, counting rules, and value settings so comparisons are fair. When different actions are needed, keep them as separate conversions but roll them into one unified outcome metric for reporting. That approach preserves detail without fragmenting the story.
How Often Should This Dashboard Be Reviewed?
A weekly review supports fast adjustments to bidding, budgets, and technical issues. A monthly review is better for evaluating theme performance, content roadmap changes, and structural account updates. Keep the same core numbers across both cadences so trends remain comparable.